Houselungo 22 August 21
A lungo length look at this week's housing market news

Stamp Duty Gap year - one year in who is winning?

On 8 July 2020 in his Plan for Jobs speech Chancellor Rishi Sunak announced a Stamp Duty Cut designed to bolster housing transaction levels and underpin house prices.
Since then, the Stamp Duty Holiday turned into a Stamp Duty Gap Year after it was extended and we now have data relating to the gap year and the gap year is a story of winners and losers, but which are you?
What did house prices do in their gap year?
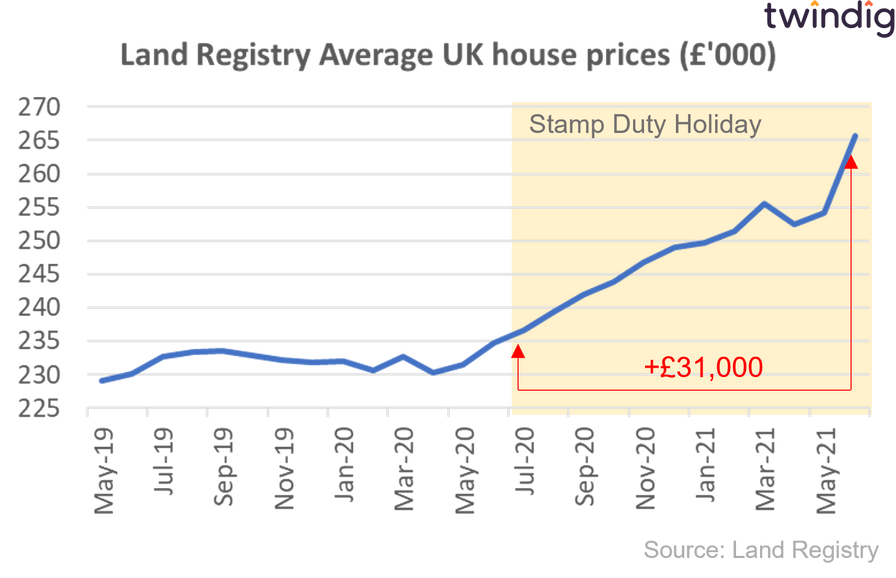
Across the UK house prices have grown significantly since the start of the Stamp Duty Holiday, reaching a record high in June 2021 of £265,668 an increase of £31,000 or +13.2% since the start of the Stamp Duty Holiday. This has been welcome good news in challenging times for those selling homes, but not so welcome news for those buying. The stamp duty holiday has been an expensive holiday.

The biggest house price winners and losers
We have crunched the house price data across each of the 375 areas reported by the Land Registry to show you who is hot and who is not when it comes to house prices
House prices rise as cliff approaches

The average house price in the UK is £265,668, average prices have increased by 13.2% or (£30,965) over the last year, and increased by 4.5% or (£11,400) last month. We note that these figures are provisional and subject to change, however, the size and the scale of these increases reflect the heightened housing market activity as homebuyers sought to complete their house purchases before arriving at the first of two stamp duty cliffs. The Stamp Duty Holiday benefit level was reduced from £500,000 on the 30 June 2021 to £250,000 from 1 July 2021
UK average house prices have increased by 15.2% (£35,059) since the start of the COVID-19 pandemic.
UK average house prices riding high
UK house prices rose by £11,400 in June 2021 as homebuyers rushed to beat the first of two stamp duty holiday deadlines.
The price rises in June reflect a continued shortage of supply in the number of homes currently for sale. In most areas across the UK demand is greater than supply and this is putting further upward pressure on house prices. Estate agents continue to report stock shortages and housebuilders are selling homes as quickly as they can build then.
In this article, we look at the house price performance of each region across England and Wales.
London house prices finely balanced

The latest data from the Land Registry shows that the average house price in London rose by 2.5% or £12,603 to £510,299 in June 2021. However, during June 2021 house prices fell in 15 of the 34 London boroughs. During June 2021 Inner and Outer London had the lowest house price inflation of all the regions across the UK.
The biggest London house price gains last month were to be found in Harrow up £21,727 or 4.3%, Camden up £17,893 or 2.1% and Kensington & Chelsea up £17,772 or 1.5%.
The biggest falls were in the City of Westminster down 3.9% or £36,295, followed by the City of London down £11,552 or 1.5% and Tower Hamlets down £9,379 or Hackney down £25,474 and Islington down £17,041 or 2.0%.
House Prices in London
The average house price in London is £510,299. This is 84% or £226,269 higher than the £284,029 average house price in England.
House prices in London have risen by 6.3% over the last twelve months compared to an average increase in house prices across England of 13.3%. In absolute monetary terms, this translates to an average increase of £30,329 in London and £33,290 in England. House prices in England have therefore increased more in both relative and absolute terms than they have in London over the last 12 months.
To see the house prices and house price trends by London borough keep reading, you will find all that house price data in the body of this article.
London House Price Outlook
In the short term, following the hiatus of the first pandemic Stamp Duty Holiday, we expect house prices in London to increase. House prices fell back in April 2021 as homebuyers agreed prices assuming that they would miss the original stamp duty holiday deadline of 31 March 2021. As London homebuyers take advantage of the extended stamp duty holiday we expect London house prices to move up.
In the medium term as the pandemic, risks subside and the UK economy is re-opened we would expect to see a continued recovery in housing transaction volumes and positive momentum maintained for house prices.
Please note that lower than usual levels of housing transactions mean that house prices at the borough level will show higher levels of volatility than normal.
Twindig housing market Index
Persimmon powering ahead

FTSE 100 housebuilder Persimmon released its first-half results this week
What they said
The housing market is robust: Forward sales 9% ahead of 2019 and private sales rate over 20% ahead of 2019
Building quality improving now ahead of the HBF’s 5-star threshold
Momentum building as the landbank is growing
Twindig take
Whilst the end of the stamp duty holiday may cause short term hiccups for some as housing transactions volumes soften, Persimmon is powering through the turbulence. With 2021 looking more like 2019 than 2020, Persimmon has put the pandemic in its review mirror and is looking to the future and investing in the future, and it is clear that Persimmon believes that the future is bright. Growing its landbank is a sign of intent that the fundamental imbalance of supply and demand of homes remains. We may be changing where we want to live, but that place is still called home, and we are not building enough of them. Whilst that shortage remains, homebuilders shares are likely to be well bid.